Monitoring Price History#
Work in Progress
Some functions for monitoring price history are works in progress.
In the FTSO system, price histories show the evolution of submitted and calculated prices over time on a line graph. The data plotted on the line graph enables you to study in detail the relationship between suspicious data providers, which you can first observe by using the collusion tool. The data on the graph includes:
- Median prices.
- Quantity of votes. This information helps you locate outage periods in which a large-enough number of providers failed to submit data to impact the graph.
- Reward bands. This information indicates the dispersion of the submitted values.
Additionally, if the price history is displayed because you selected data providers by using the collusion tool, the graph includes submissions by those providers, enabling you to see:
- Whether a submission is inside or outside of the reward band and by how much.
- Whether multiple providers were chasing each other instead of the median, which could imply collusion.
Price-History Dashboard#
The elements of the dashboard are:
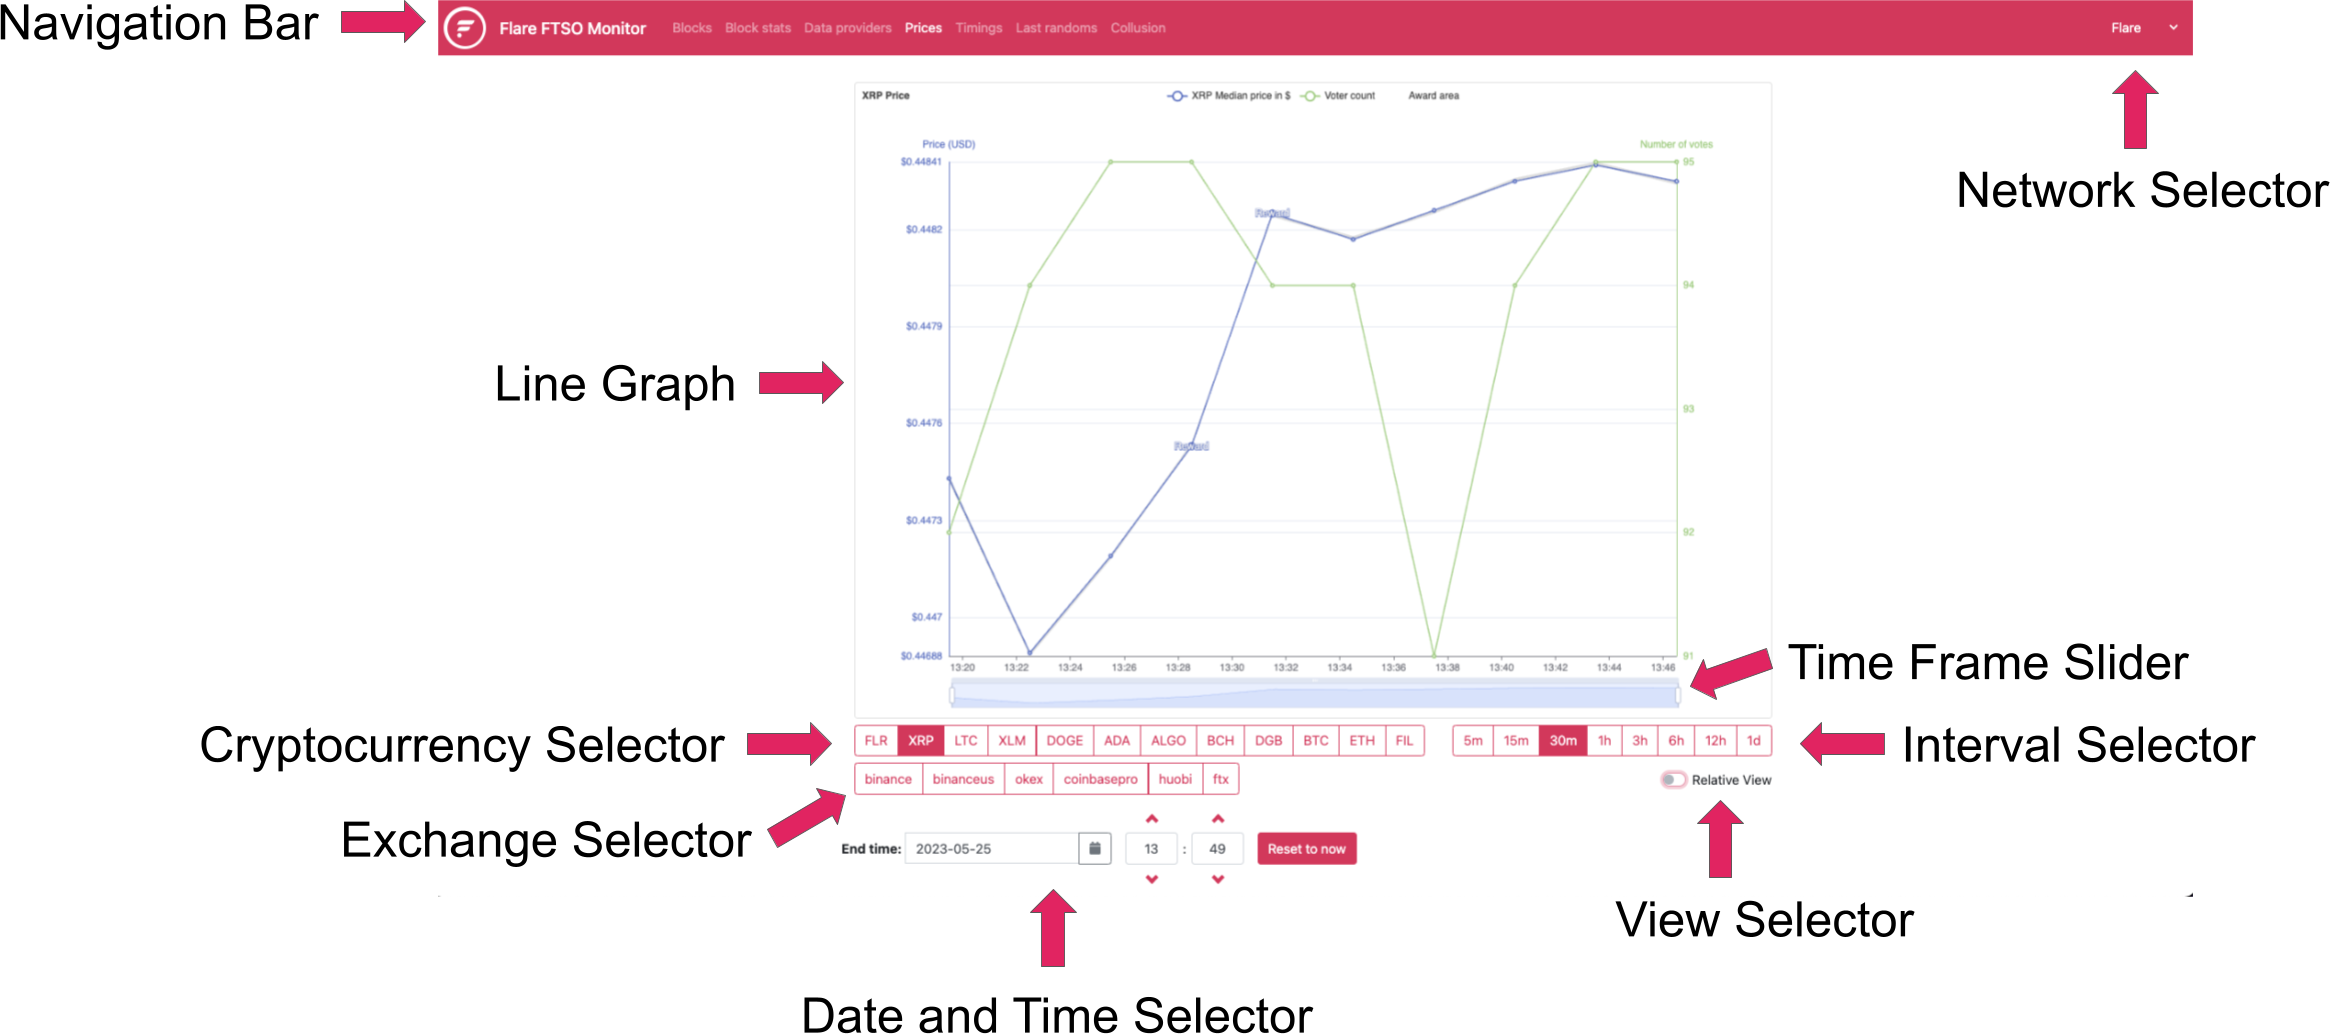
- Navigation Bar: The main functions of the Flare FTSO Monitor.
- Network Selector: Toggles between FTSO Monitors for other Flare networks.
- Line Graph: Displays the price history and the number of votes when you are not comparing specific data providers.
- Cryptocurrency Selector: Toggles between supported cryptocurrencies.
- Exchange Selector: Feature is currently not enabled.
- Date and Time Selector: Isolates the price history for the date and time you specify.
- View Selector: Toggles to relative view, which typically makes reward bands on the graph more apparent.
- Time Frame Slider: Changes the time frame displayed in the graph based on selections you make by moving the slider.
- Interval Selector: Toggles the interval during which you want to view price history.
The default settings are:
- Cryptocurrency symbol:
XRP - Time frame:
30m - End time: The current date and time when you opened the Prices tab.
Comparing Price History#
- Open the price-history dashboard in the FTSO Monitor. The price-history dashboard, which is based on the default settings, is displayed.
- Optional: If you need to monitor the FTSO ecosystem on a different network, click the Network Selector, as shown in the price-history dashboard, and select a different network.
-
For more specific comparisons, change the default settings by using the various elements in the dashboard to further express the data:
- Toggle the currencies and interval.
- Adjust the date and time.
- Add or remove from the graph some data, such as an address, a currency's median price, the voter count, and the award area.
If the price-history dashboard opened because you compared data providers using the collusion tool, the list of data providers is also displayed below the dashboard.